Technical Analysis Training Course - Free

Free Technical Analysis Course

You’ll get to know the different types of chart available and how they work. And you’ll learn to identify some key chart patterns and understand their implications.

We’ll also introduce you to some of the most popular technical indicators – tools you can use to derive trading signals from market price data – and show you how to apply them.

ফ্রি কোর্সে অংশগ্রহনের জন্য আমরা ৫০০ টাকা অগ্রিম গ্রহন করে থাকি। কোর্সে অংশগ্রহণকারীকে টাকা ফেরত দেয়া হবে। কোর্সে অংশগ্রহন নিশ্চিত করার জন্যই ৫০০ টাকা গ্রহন করা হয়ে থাকে। যদি কেউ রেজিস্ট্রেশন করার পর কোর্সে অনুপস্থিত থাকেন তাহলে সেটি তার অনুপস্থিতির জন্য কর্তন করা হয়। অনুগ্রহ করে কোর্সে অংশগ্রহনের সময় আপনার ইনভয়েসের প্রিন্টেড কপিটি উপস্থাপন করুন।

Companion Course:

Course Instructor :

Khan Muhammad Kawser Ahmed

Khan Muhammad Kawser Ahmed (EEE, BUET) is an active investor in stock market from the year 2007. From 2010 to 2013, he successfully trained people on stock investing and Forex trading via his training institute InvestoPower. Then in 2014, he founded SOFTEKO, a software and content producer company. Under this brand, he is running ExcelDemy.com where he publishes Excel tutorials and templates on Finance, Stock, Data Analysis, etc. He is working on a web application that will hugely benefit the stock traders of Bangladesh.

You can call him a fusion trader. At first, he thoroughly checks out the Macro Economic Indicators, then he chooses the best Fundamental Stocks from the market based on a screener (an Excel Template he uses personally), but for entry he uses Technical Analysis.

He believes in if you cannot make money from the Stock Market, you’re not eligible to teach anyone stock trading. So, he dares to teach as he made and can make money from the stock market.

Course Instructor :

Ponkaz Nandy
Ponkaz Nandy

Ponkaz Nandy is an experienced technical analyst working for several international financial company in past 8 years from 2011. He spent most of his hours in analyzing the market and learning the never-ending process in technical analysis. Mostly he is a price action trader. He analyze the market chart with market context.

CMT (Chartered Market Technician) in Progress.

CURRICULUM WHAT YOU'LL LEARN WHO SHOULD TAKE THIS
Module 1 - Theory and History
  1. Technical Analysis
  2. Advantage and limitations of technical analysis
Module 2 - Chart and its components
  1. Type of Charts
  2. Candlesticks
  3. Important Candlestick Patterns
Module 3 - Market Indicators
  1. What is Moving Average
  2. Importance of Moving Averages
  3. Types of Moving Averages
  4. Uses of Moving Averages
  5. Moving Average Convergence Divergence (MACD)
  6. Relative Strength Index (RSI)
  7. Money Flow Index (MFI)
  8. Stochastics (STOCH)
  9. Volume
Module 4 – AmarStock.com
  1. How to use AmarStock.com
  2. Why use AmarStock.com
  3. Key features & tools of AmarStock.com
  4. How to take advantage of AmarStock.com
  5. How to trade with AmarStock.com
Module 5 – Question & Answer
  • Question and Answer Session

Desk Ready Skills

  • In this course you’ll find charts and illustrations demonstrating how technical analysis can highlight potential opportunities to go long or short. To give you a flavour of what to expect, here’s an extract explaining the concepts of support and resistance:
  • The lines marked 1 and 2 below each represent a support or resistance level. Which is which?
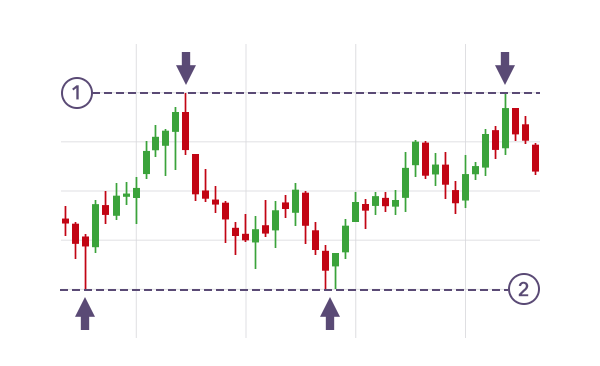
  • A. Line 1 is support, line 2 is resistance
  • B. Line 1 is resistance, line 2 is support
  • Answer is B.
  • Resistance is the ceiling that the price struggles to break through. Support is the floor where the price tends to stop declining.

RECOMMENDED FOR:

Portfolio managers Day Traders General Investors

Contact

AMARSTOCK LIMITED

Apartment B# 2,

House # 13,

Road # 27, Banani,

Dhaka - 1213

SCHEDULE
Every Alternate Saturday
11:00AM – 2:00PM

In Person

3 Hours

Bangla

Introductory
Cost: FREE

Register Now

Location